THE GENDER DISPROPORTION


With the constant reiteration and reminders of the lack of women in the industry, some might be wondering how extensive the disproportion really is. Below are a series of graphs conducted by a multitude of sources, each reaffirming the rate at which the inequality between genders still persists. How many men are there to women? If the women are not working in the STEM field, where are they? Might they study a STEM subject but work somewhere else?
The S.T.E.M. field is largely male-dominated as it contains a minority of women, illustrated by the graph on the left. From this we can see the evolution of female percentages from 1970 to around 2010. The quantity of women who major in computer science has consistently exceeded those in engineering. In 1970, the percentage of women enrolled in engineering was almost null, gradually increasing to about 10% in 2010. On the other hand, women in computer science peaked during the early-mid 1980s from about 15% in 1970 to 35%. From then, the percentage has diminished until it reaches approximately 20% in 2010, similar to the statistics of engineering. In comparison to women across all majors, who comprise roughly 50% of the workforce, the number of females majoring in a S.T.E.M. subject is vastly disproportionate. This brings in the question: where do they go? Represented by the graph on the right, women have been shown to involved themselves in careers pertaining to the fields of psychology, education, social work, and health professions. For the most part, health professions dominate in major for female undergraduates, comprising over 75% of them from 1970 to 2010. The rest of the majors constitute around 75% of undergraduates that are women, compared to the approximate average of women across all majors, which resides around the 50% benchmark.
CONCLUSION
Equal gender distribution have found significant advances in the vast majority of fields, except that of science, technology, mathematics, engineering, and computer science. This is due in part by lack of recognition that women in this field have received in the past, which therefore leads to false beliefs set in place by society wherein women do not have the level of intellect necessary to pursue a career that is deemed academically challenging. However, women who decide to enter the S.T.E.M. field have a tendency to study science and biology, which in turn entails greater disproportion in areas such as computer science and engineering. These choices have consequences; on average, jobs in computer science and engineering industries are linked to better outcomes in the labour market in terms of salary, rates of employment, and job matches.
Source: Statistics Canada, article entitled "Gender differences in science, technology, engineering, mathematics and computer science (STEM) programs at university" by Darcy Hango
UNIVERSITY PROGRAMS & POST-SECONDARY EDUCATION

A breakdown of individual career fields inside STEM reveal that there are a larger quantity of men in Canada graduating in 2011 with a degree in mathematics and computer science as well as engineering, but more female graduates in science and technology. This is due in part by the large female interest in enrolment for biological sciences, without which the male-dominated disproportion would be more apparent. Overall, the graph on the left suggests that the general quantity of masculine STEM university graduates greatly exceeds the number feminine graduates within 25 to 34 years of age in 2011. However, this tendency can be traced throughout history and to the present day.
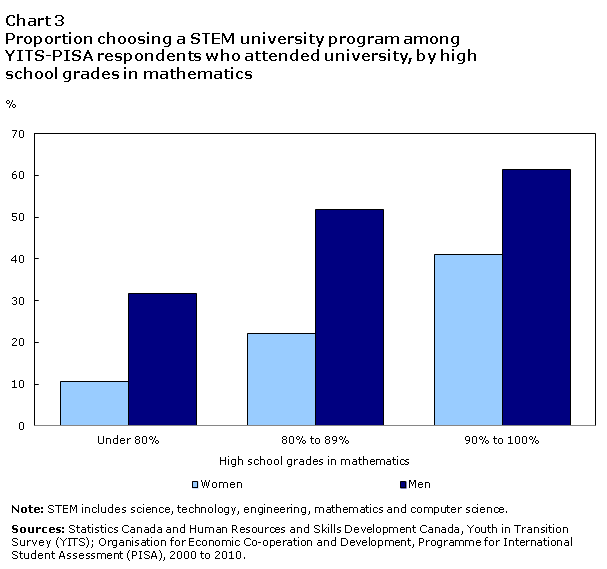
Girls are found to require more confidence and systemized support whilst pursuing a career in STEM due to stigma that surrounds such. Illustrated with the graph below, the ratio of difference between male and female respondents that chose a STEM university program increases as the candidates high school mathematics grades decrease.
Between 2000 and 2008, the number of women interested in majoring in computer science dropped 79 percent.
Source: National Science Foundation


As stated above, the number of women rival that of men in concerns to agricultural sciences and biological sciences. In 2007, there were 48 001 women to 31 347 men in biological sciences, and 8 915 women to 8 781 men. However, in the other selected science and engineering fields, the opposite is true. For example, there a larger quantity of men who earned Bachelor's Degrees in physics, earth, atmospheric, and ocean sciences, chemical engineering, mechanical engineering, electrical engineering, civil engineering, chemistry, mathematics and statistics, and computer sciences. This disproportion exists in all areas of STEM, with the exception of biological/agricultural sciences, but exhibits itself particularly in engineering fields, as opposed to science-related ones.
Not only is there a under-representation of gender, but also in terms of racial-ethnic groups. As visualized through the graph below on the right, the gender disproportion remains present throughout various racial groups, highlighted through the number of male and female Hispanics earning Bachelor's Degrees in engineering and computer sciences.
However, the number of women in selected STEM fields is gradually increasing (graph below on the left) from 1966 to 1976, 1986, 1996 and 2006. These fields include biological and agricultural sciences, earth, atmospheric, and oceanic sciences, chemistry, mathematics, computer science, engineering, and physics.


